Cluster dashboards
Let's head over to the dashboard section and visualize the EKS cluster metrics collected by the CloudWatch agent.
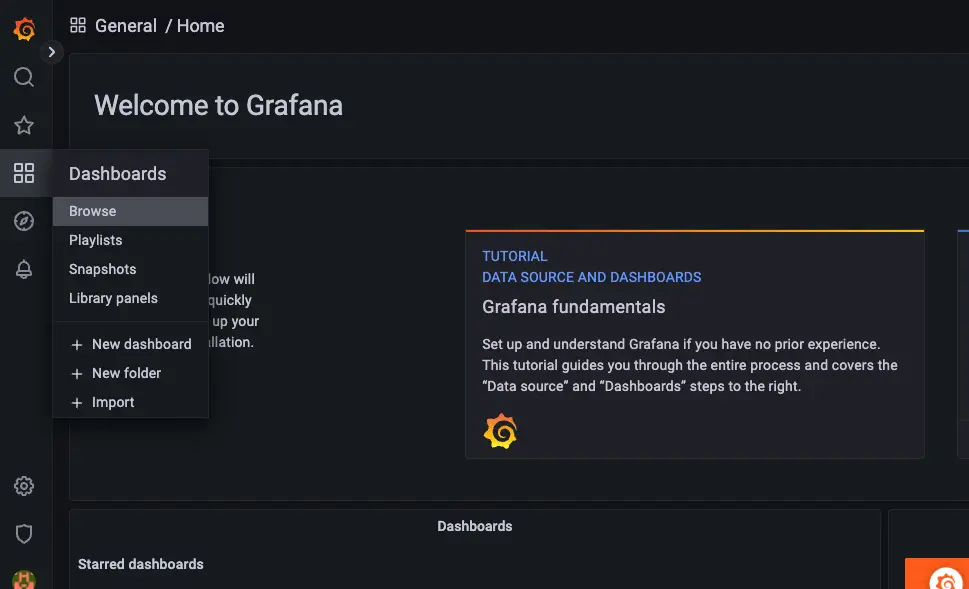
Click the dashboard Kubernetes cluster monitoring (via Prometheus) and let's review a panel within the dashboard.
The Total Usage panel shows the overall cluster usage of CPU, memory and filesystem.
